The economic growth threshold for job creation in Spain: The importance of wage moderation
Recent evidence suggests that the Spanish economy can create jobs at a lower rate of economic growth than in the past. However, the lower growth threshold for job creation depends on sustaining wage restraint.
Abstract: According to analyst consensus, the growth threshold for job creation in Spain had generally been around 2%. However, structural reforms undertaken in recent years, in particular the labour market reform of 2012, seem to have made the Spanish economy more flexible, competitive, and able to generate employment at a growth threshold lower than in the past. Our data show that the recent increased dynamism of the Spanish job creation process has been concentrated in the private sector, manufacturing industry and full-time employment. Furthermore, our analysis suggests that wage restraint is a key factor behind the process of job creation at lower growth rates. If this hypothesis is true, the validity of existing forecasts that are based on a lower growth threshold for job creation in Spain depends on maintaining the current levels of wage moderation.
Appearing before the Congressional Economic Committee on April 19th, the Acting Minister for Economic Affairs and Competitiveness, Luís de Guindos, said that between 2016 and 2019, the Spanish economy will create half a million net jobs a year. This will make it possible to bring the unemployment rate down to 14% of the labour force by 2019. According to the latest Labour Force Survey (LFS), corresponding to the first quarter of 2016, the unemployment rate in Spain is currently 21%.
A million (net) jobs have been created over the last two years (a rate of half a million a year) and gross domestic product (GDP) has grown at an annual average of 3.25%. The Ministry of Economic Affairs and Competitiveness’s projections imply that the rate of job creation will continue during a period in which the forecasts point to a slowdown in the rate of GDP growth. For example, in its latest report, the International Monetary Fund (IMF) forecasts that the Spanish economy will grow at an average of 2.29% a year between 2016 and 2019, one percentage point less each year than in the period 2014-2015, and slightly lower than the government’s estimate of 2.5% (IMF, 2016). Are the Spanish Government’s forecasts too optimistic? What assumptions has the government based its projections on?
One of the key assumptions of the government’s programme, set out in the Stability Programme, refers to Spain’s growth threshold for net job creation. According to the government, the structural reforms undertaken in recent years, in particular the labour-market reform of February 2012, were sufficiently far reaching to make the Spanish economy more flexible and competitive, and consequently have allowed it to generate employment at lower rates of economic growth than in the past. According to the government, the growth threshold for job creation, which past analysts’ consensus had put at around 2%, could now be as low as 0.7%. In other words, according to the government, the Spanish economy is able to generate net employment provided it grows at or above 0.7%.
The importance of the debate on this topic stems from the fact that Spanish economic growth is expected to decrease to rates of 2% or less in 2017. The fear is therefore that the Spanish economy will stop generating employment, despite continued growth. However, this fear would be allayed if, as the government claims, the threshold for job creation is significantly below 2%.
It should be borne in mind that the global economy, particularly the economies of the developed countries, are undergoing a period of sluggish growth, with a slow take-off after the financial crisis. Larry Summers, the former U.S. Treasury Secretary under President Bill Clinton, and former President of Harvard University, coined the term “secular stagnation” to refer to a state of permanently low economic growth. Economists continue to debate the validity of this concept and the possible causes of such low economic growth. These range from underestimating the impact of new technological revolutions, to demographical phenomena, or the aftermath of the devastating financial crisis. What is clear, however, is that there are various theories seeking to explain the lacklustre growth of most developed economies, which are expected to grow at significantly slower rates than in the last few decades.
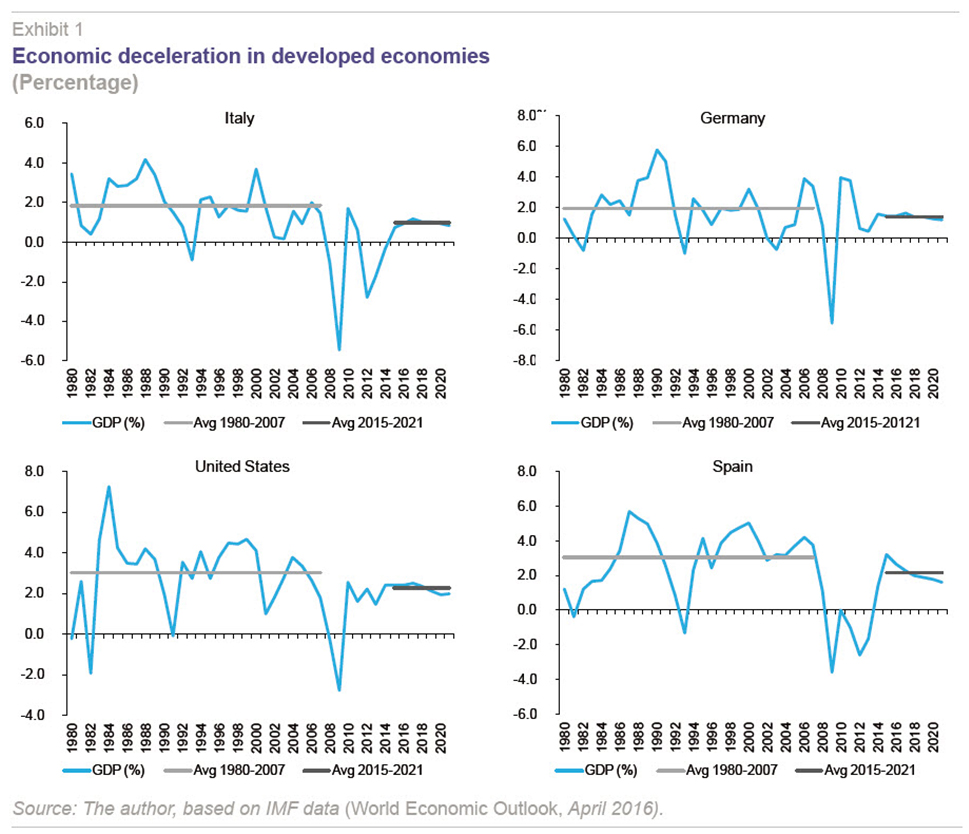
Exhibit 1 shows GDP growth rates between 1980 and 2021 (according to IMF projections from 2016 onwards) for Italy, Germany, the United States and Spain. In all cases, average growth for the period 2015-2021 is projected to be significantly lower than the one between 1980 and 2007, before the outbreak of the financial crisis. In the case of Spain, the difference is almost one percentage point a year. What’s more important, the IMF expects Spain’s economy to grow at a rate of less than 2% from 2018 onwards, with a progressive deceleration of the growth rate towards 1.5% in 2021. In this context, the discussion about the growth threshold for job creation becomes particularly significant.
What do we know about the growth threshold for job creation?
Until recently, the consensus among economists was that the Spanish economy would not generate employment unless it grew at a rate of over 2% a year (Becker, 2011). With the February 2012 labour-market reform, Spain’s job market gained in internal flexibility, which is to say, in the possibility of adjusting wages and other working conditions. This meant that employers could adjust wages and working hours in response to a negative shock rather than cutting jobs. Among other things, the 2012 reform cut the cost of dismissing permanent employees, made it easier for companies to opt out of collective wage agreements, and extended the range of situations in which employers can cut working hours (and wages) in response to a negative demand shock. This greater flexibility could lead to increased job creation even in periods of sluggish economic growth. Recent studies, such as that by Cea and Dolado (2013), estimate that Spain’s net job creation threshold is around 1.3%. The authors used data from 1980 to 2012 to estimate a CES production function in which not only the historical relationship between GDP growth and job creation is taken into account, but also the degree of wage restraint and the composition of the work force, distinguishing between permanent and temporary employees. The idea underlying these estimates is that the level of job creation depends not only on the GDP growth rate, but also on the pressure exerted by wages or the incentive effect of greater wage restraint. This result is similar to that given in the Ministry of Employment and Social Security’s evaluation report on the impact of the labour-market reform, which was based on 2013 data. This report estimated that the job creation threshold could be somewhere between 1-1.2% (Ministry of Employment and Social Security, 2013).
Descriptive evidence
This section aims to offer additional descriptive evidence on the relationship between the Spanish economy’s GDP growth rate and employment creation (or destruction). For this purpose, we have drawn upon GDP data from the national accounts published by the National Statistics Institute (INE) and the
Labour Force Survey (LFS) between 1987 and 2016 (first quarter).
[1] The most interesting aspect of this descriptive exercise, and the main difference from other, previous, analyses, is that it includes more recent data, which is important to assess the possible impact of the 2012 labour-market reform. The exhibits below are the result of calculating annual growth rates in employment and GDP levels. To this end, the levels of a given quarter were compared with the levels of the same quarter the preceding year, thus eliminating possible seasonality in job creation and economic activity. According to these data, the Spanish economy began to create (net) jobs in the second quarter of 2014 and continued to do so continuously until the first quarter of 2016 (the most recent data available). This makes eight consecutive quarters of net job creation. Moreover, GDP began to grow on a year-on-year basis in the first quarter of 2014 at a rate of 0.42%. This rate accelerated progressively to reach 3.54% in the last quarter of 2015. The data from the first quarter of 2016 suggest a slight slowdown in GDP growth to 3.39%. This moderate deceleration is consistent with the longer-term projections mentioned above, which point to a slowdown in the Spanish economy’s growth rate to below 2% from 2018 onwards.
The data corroborate the conclusions put forward by previous studies. In 2014, the Spanish economy added over 400,000 jobs despite economic growth averaging just 1.36%. Even in those quarters in which growth was close to 1%, the Spanish labour market was able to generate net employment.
Exhibit 2 shows the relationship between the rate of job creation (destruction) on the vertical axis and the rate of GDP growth (horizontal axis). Each point on the exhibit corresponds to a quarter, distinguishing between quarters after the labour-market reform was passed in February 2012 (in blue) and previous quarters (in gray). The exhibit also includes a trend line on the assumption of a linear relationship between the two variables. Taking this trend line as a reference, a change in level is observed as of the second quarter of 2012. In other words, from 2012 onwards, the Spanish economy destroyed fewer jobs for each percentage point of negative GDP growth and was able to create more jobs when the economy grew. It is also interesting to note how the 2% limit for job creation clearly shows up in the exhibit before 2012. Prior to 2012 there was only net job creation when GDP growth rates exceeded 2%. However, this was not the case for data post-2012, when the job creation rate turned positive at GDP growth rates of 1% or slightly higher. A slight reduction of the relationship between net job creation and GDP growth can also be seen in the exhibit. Thus, during the first half of 2015, the Spanish economy created net jobs at a rate of 3% a year while the economy grew at 2.94%. However, in the second half of the year, the rate of job creation stagnated at values of around 3%, even though the pace of GDP growth accelerated to 3.5%. It may be that the rate of job growth was faster at the start of the recovery, due, for example, to greater wage restraint in the early stages of the economic cycle and in comparison with those phases in which economic growth had consolidated.
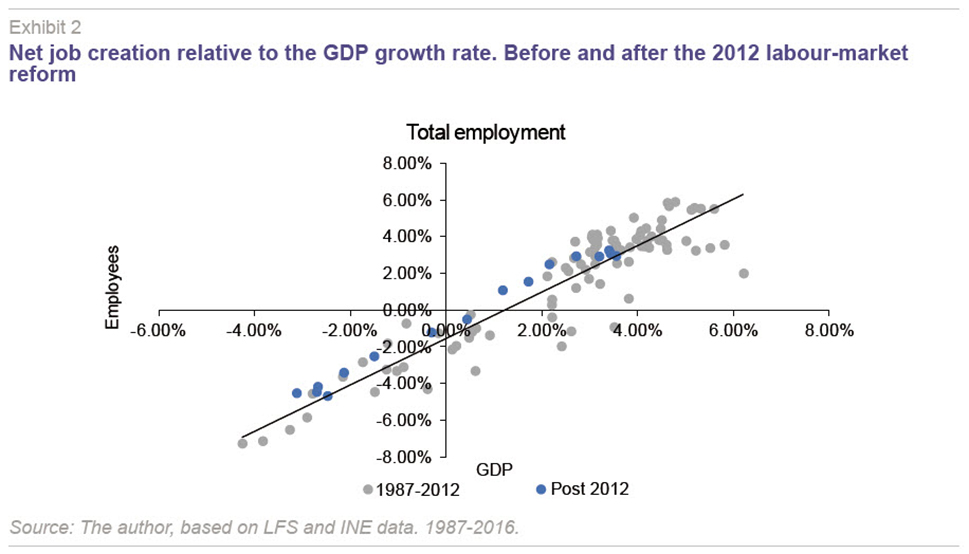
Exhibit 3 shows the data for the period between the fourth quarter of 1993 and the first quarter of 1996 in light blue. This period covers the start of the economic recovery following the crisis in the nineties. The exhibit also shows the immediately subsequent period of economic growth, between the second quarter of 1996 and the third quarter of 1998. In the first period of growth (‘recov 9496’) the 2% growth limit is clearly visible as an impassable barrier. However, the exhibit does not show signs of a clear slowdown in the rate of job creation in the immediately subsequent period. On the contrary, when the recovery gained traction and GDP grew at rates of over 3% in 1997, job creation soared, reaching rates of 3.5% or even 4.0% a year. It is only when GDP growth rates are over 4% (in 1998) that the rate of job creation levels at around 4%. To sum up, although Exhibit 2 suggests that the 2012 labour-market reform has resulted in a higher rate of job creation at lower levels of economic growth, this is not the case at higher levels of GDP growth, for which the rate of employment growth following the 2012 reform is similar to that seen in previous recoveries.
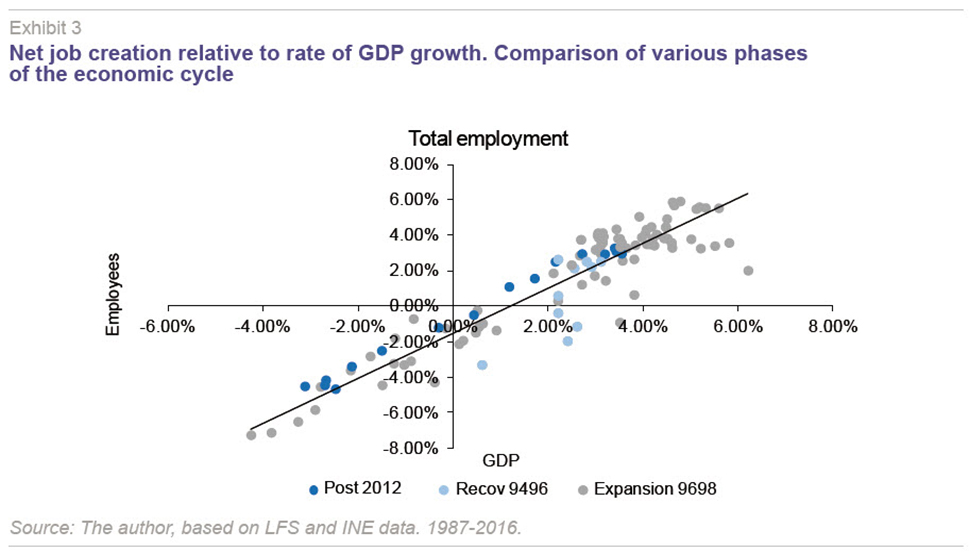
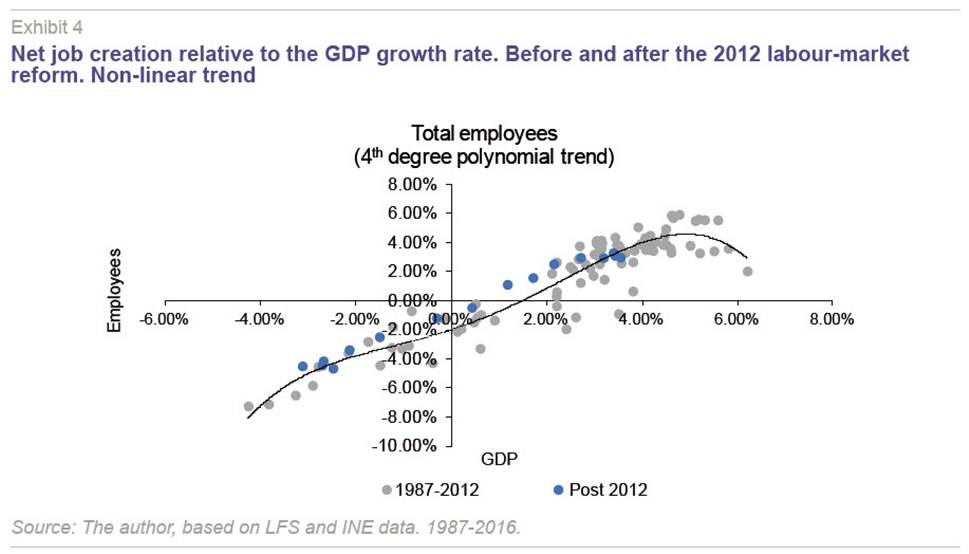
Exhibit 4 shows the same data as Exhibit 2, but now adds a fourth degree polynomial trend line. There is nothing in economic theory or from the observation of the data that justifies a linear trend. In fact, observation of the data prior to 2012 suggests a non-linear relationship between economic growth and job creation, with levels of job creation below the trend line for growth rates of less than 2% and a degree of acceleration in the rate of employment growth for higher growth rates. Thus, Exhibit 4 shows this non-linear relationship and the levelling off of the trend for growth rates of less than 2%. The exhibit clearly shows the higher rate of job creation (or the lower rate of job destruction) post-2012 when GDP growth has been slightly negative or slightly positive (between -2% and +2%). However, it is also evident from the exhibit that the rate of job creation (or destruction) in the post-reform period is similar to that in previous periods when GDP grew or contracted at relatively high rates.
The 2012 labour-market reform and an analysis disaggregated by worker groups
This section presents the findings concerning different types of workers. The aim is to elucidate the drivers of the faster job creation seen since 2012. Is it due to greater private or public sector dynamism? What types of jobs have been created and how does the process compare to previous recoveries? Are the jobs that have been created full-time or part-time?
This set of questions needs to be addressed in the context of the 2012 labour-market reform. The February 2012 reform introduced three fundamental changes in labour relations.
[2] First, it profoundly changed the framework of collective bargaining, putting the emphasis on agreements at the company level, rather than the sector and province levels. The aim was to give collective bargaining greater flexibility, so agreements could be adapted to each company’s individual circumstances. Secondly, it made it easier for companies to adjust working conditions, such as the length and structure of the working day, to adjust to changes in the demand for their products. The male part-time employment rate, traditionally very low, went from 6.1% before the reform to 8.1% in the first quarter of 2016 (the female part-time employment rate remained virtually unchanged). Finally, with regard to contract types, the 2012 reform significantly reduced redundancy costs in the case of employees on permanent contracts. However, big differences remain in the degree of protection given to permanent and temporary workers. It is not therefore clear whether the 2012 reform has significantly modified the company’s incentives to hire workers on permanent or temporary contracts, and it would be interesting to see how much of the dynamism of employment creation is due to new jobs under each of the different types of contracts.
Panels a and b of Exhibit 5 distinguish between public- and private-sector employees. The comparison is interesting as it reveals that the increased dynamism of job creation during the current recovery is entirely due to the private sector. In keeping with the fiscal adjustments that have been implemented in Spain and in other euro area countries since 2011, public sector employment has grown more slowly in this recovery than in previous periods. Consistent with this fiscal adjustment process, public sector employment in 2012 and 2013, far from being a counterweight to job cuts in the private sector, has been hugely negative. Thus, in the second quarter of 2012 and the fourth quarter of 2013, over 200,000 net jobs were destroyed in the public sector, a third of the total jobs lost during the period. This contrasts with the more than 150 thousand net jobs created in the public sector between the last quarter of 2008 and the first quarter of 2012. If we focus on 2014, the first year of the recovery, when economic growth was still sluggish, we can see how, although employment in the public sector contracted slightly, the Spanish economy was still able to create 400,000 net jobs, all of which were in the private sector.
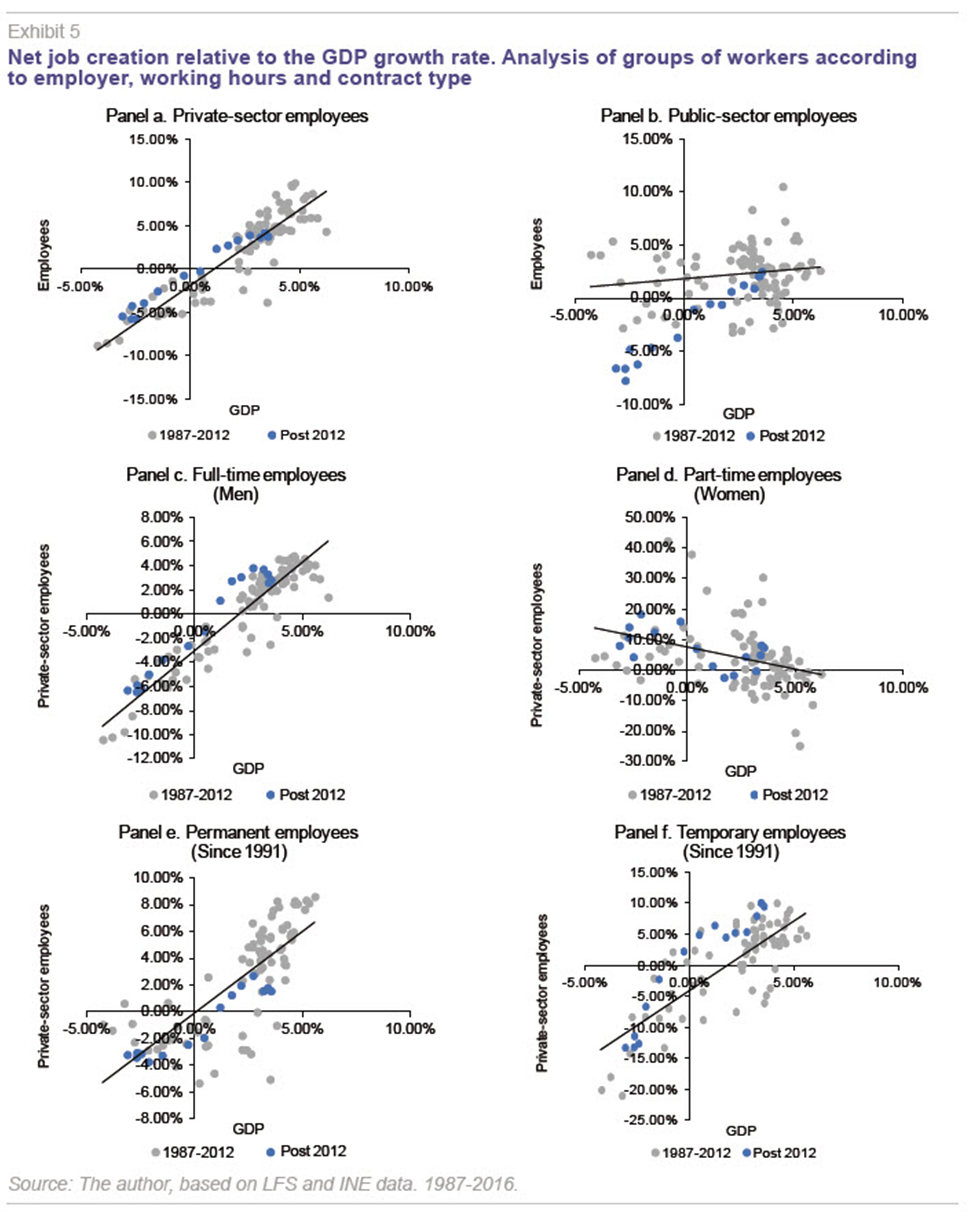
Comparing panels c and d of Exhibit 5 also shows that the lower growth threshold for net job creation is due to the creation of full time jobs and not part-time ones, as could be feared given that the 2012 reform made it easier to sign contracts of this kind. The reform does seem to have had an effect on part-time job creation in the periods of recession, in which this type of employment grew in relative terms. However, once the recovery had gotten under way, no growth in part-time contracts was observed. Instead, full time contracts accounted for all job creation.
Finally, panels e and f of the exhibit show that temporary employment has surged relative to permanent employment.
[3] Panel f clearly shows how in the post-reform period, job creation on temporary contracts was well above the trend line extrapolated from the data prior to the 2012 reform. However, in the case of employment on permanent contracts, the message is somewhat ambiguous. At low levels of economic growth (GDP growth < 2%) a rise in the number of permanent jobs is observed, contrasting with pre-crisis periods, when permanent jobs were only created when GDP growth was over 2%. However, for GDP growth rates of over 2%, the rate at which permanent jobs were created is significantly below the trend line. This could be due to the incipient stage of the economic recovery and it will therefore be interesting to see if, in the future, when the recovery has gained traction, permanent job creation grows at similar –or even faster– rates than before the 2012 reform.
Analysis by sector
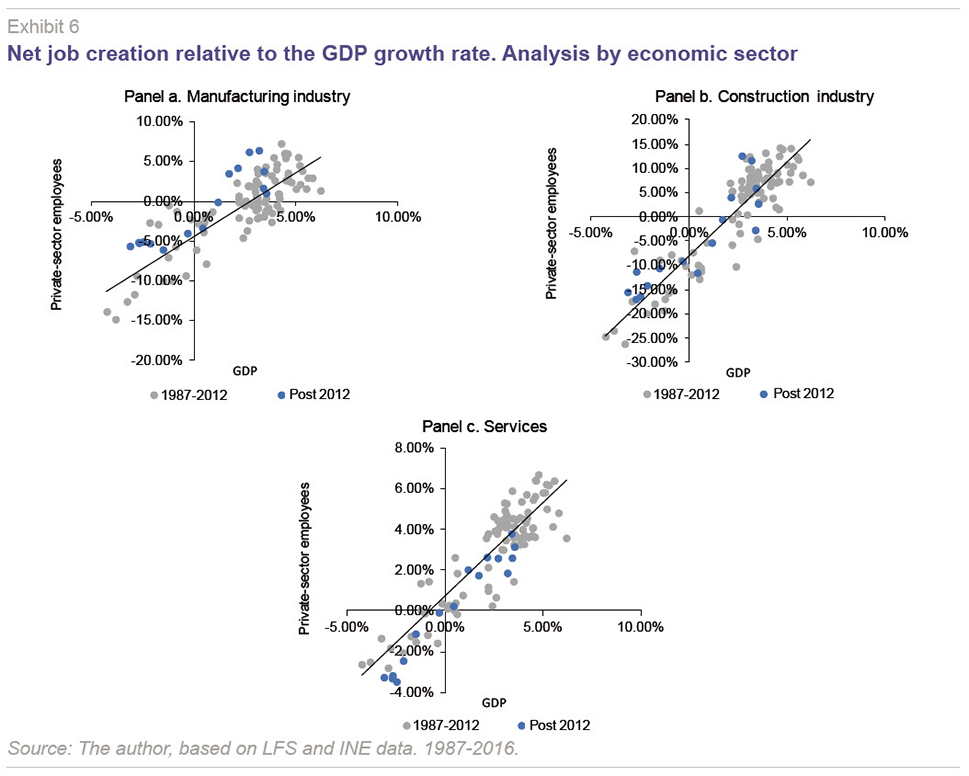
Exhibit 6 shows the analysis by sectors of activity. If we focus on the part of the exhibit corresponding to low levels of economic growth (below 2%), we see how the lower growth threshold for job creation is a phenomenon primarily observed in the manufacturing industry and not in the construction or services sector. One hypothesis is that the greater dynamism of manufacturing is due to the positive impact of wage restraint following the 2012 reform and the consequent growth in Spanish exports.
Concluding remarks
Various sectors of Spanish society have claimed that Spain’s labour market has recently been able to generate employment even when the economy is growing at less than 2%. Whether or not the growth threshold for job creation has been reduced is an important topic in view of the various organisations’ projections suggesting that the Spanish economy could grow at less than 2% from 2018 onwards. The most recent growth and job creation data confirm the findings of previous studies and suggest that the Spanish economy could create net employment when GDP grows at or above 1%. This increased dynamism in job creation is concentrated in the private sector, in manufacturing, and in full-time employment. The data do not allow us to say that there is greater dynamism in the creation of stable jobs, with permanent contracts. However, there is a clearly greater dynamism in the case of temporary employment. The mechanisms underlying this reduction in the growth threshold for job creation remain unknown. However, the data are consistent with the hypothesis that this process is related to the wage restraint following the 2012 reform, as the benefits are concentrated in the manufacturing industry and temporary contracts in times of low economic growth. Confirmation of this hypothesis implies that the existence of a lower growth threshold for job creation depends on the continuation of this wage restraint.
Notes
There is a jump in 2005 in the series of tables published by the INE due to the change in the census values used for weightings and to construct representative samples of the Spanish population. The values of the 2011 census replaced those of the 2001 census as the basis for the calculations. For this reason, the exhibits and analysis below omit all four quarters of 2005.
For a detailed analysis of the content of the reform and its effects, see García-Pérez and Jensen (2015).
The data shown in the panels go back to 1991 in order to include a period in which temporary contracts, which were reformed in 1984, were fully established in the Spanish labour relations framework.
References
BECKER, F. (2011), “El factor institucional en la crisis económica española,” Revista del Instituto de Estudios Económicos, No. 2/2011: 53-79.
DE CEA P., and J. J. DOLADO (2013), Output Growth Thresholds for Job Creation and Unemployment Reduction in Spain, mimeo, Carlos III University.
GARCÍA-PÉREZ J. I., and M. JENSEN (2015), “Reforma laboral de 2012: ¿Qué sabemos sobre sus efectos y qué queda por hacer?,” Fedea Policy Papers, 2015/04.
IMF (2016), World Economic Outlook, April.
MINISTRY OF EMPLOYMENT AND SOCIAL SECURITY (2013), Informe de Evaluación del Impacto de la Reforma Laboral [Evaluation report on the impact of the labour-market reform], Madrid.
Daniel Fernández Kranz. Head and Associate Professor of the Economic Environment Department, IE Business School, Madrid.